The Client
The Government of India set up the Bureau of Energy Efficiency (BEE) on 1st March 2002 under the provisions of the Energy Conservation Act, 2001. The mission of the Bureau of Energy Efficiency is to assist in developing policies and strategies with the primary objective of reducing the energy intensity of the Indian economy.
BEE coordinates with designated consumers, designated agencies, and other organizations to recognize, identify, and utilize the existing resources and infrastructure. Another major task of BEE is to create awareness and disseminate information on energy efficiency and conservation.
BEE and WRI chose Ebizon as their vendor to create a digital platform – Urja Dakshata Information Tool (UDIT) (www.udit.beeindia.gov.in) to facilitate a database on energy efficiency and spread awareness about the ongoing initiatives and its impact in the Indian energy sector.
UDIT is a user-friendly platform that explains the energy efficiency landscape of India across industry, appliances, building, transport, municipal and agriculture sectors. UDIT also showcases the capacity building and new initiatives taken up by the Government across the sectors in the increased energy efficiency domain.
Business Challenges
BEE had a unique set of challenges due to the diversity of the energy sector and the target audience.
The first challenge was to design a platform that would be easy to understand and use for both well-versed researchers/policymakers and laymen so as to capture the audience’s interest and present data-intensive information in a simple way. BEE and Ebizon had to present the information on the website in a way that was easy to understand, interesting and gave the audience an incentive to come back for more.
The second impediment was to collect data from multiple sources. Each sector that consumes energy in India is under the purview of different ministries and departments. The lack of standard and clean data was another major issue. Coordinating with each department to collect data alone required multiple levels of approval which were a time-consuming process and made following a conventional project lifecycle approach impossible.
Our Solution
Ebizon along with the World Resource Institute tackled the task of data collection first. A joint meeting of sector department heads was convened where the data and gaps were discussed in detail.
Data was gathered from other sources as well e.g. BEE schemes data, KPMG report, Unnati website, etc. As data from different sources was structured differently, collected data had to be mined, structured to be usable by data visualization tools to create various analyses. Therefore, Ebizon deployed a senior data consultant to design a master data structure that standardized the data collection process.
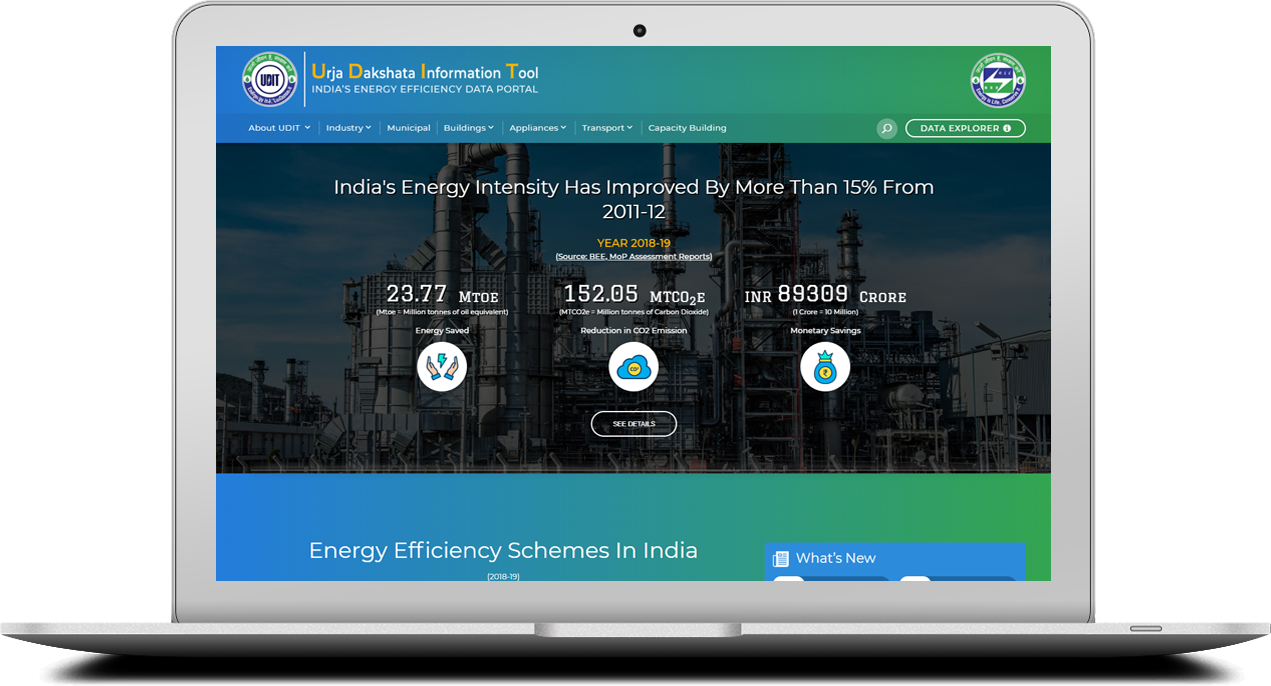
The platform highlights the data insights in the form of data visualizations. The Home Page showcases the country’s macro snapshot of energy efficiency along with giving visual insights into the central schemes under BEE. There were add-on features that showcase- data visualization at sector levels of energy savings, carbon emissions, and monetary savings due to the energy efficiency schemes, news, and events from each scheme and success stories categorized at an international, national, and scheme level.
The main menu of the platform takes users to internal chapters for each scheme, which was categorized according to the sectors showcasing energy efficiency programs under industries, buildings, appliances, and municipalities. The main menu featured BEE’s capacity building initiative in the distribution and transmission sector and a Data Explorer for additional analysis for advanced users.
The website had to be a microsite to BEE and would link all the scheme-specific sites maintained by BEE. The USP of the platform was its Dashboard (Data Explorer), Integration of energy efficiency with supply-side and Indian energy efficiency success stories pages.
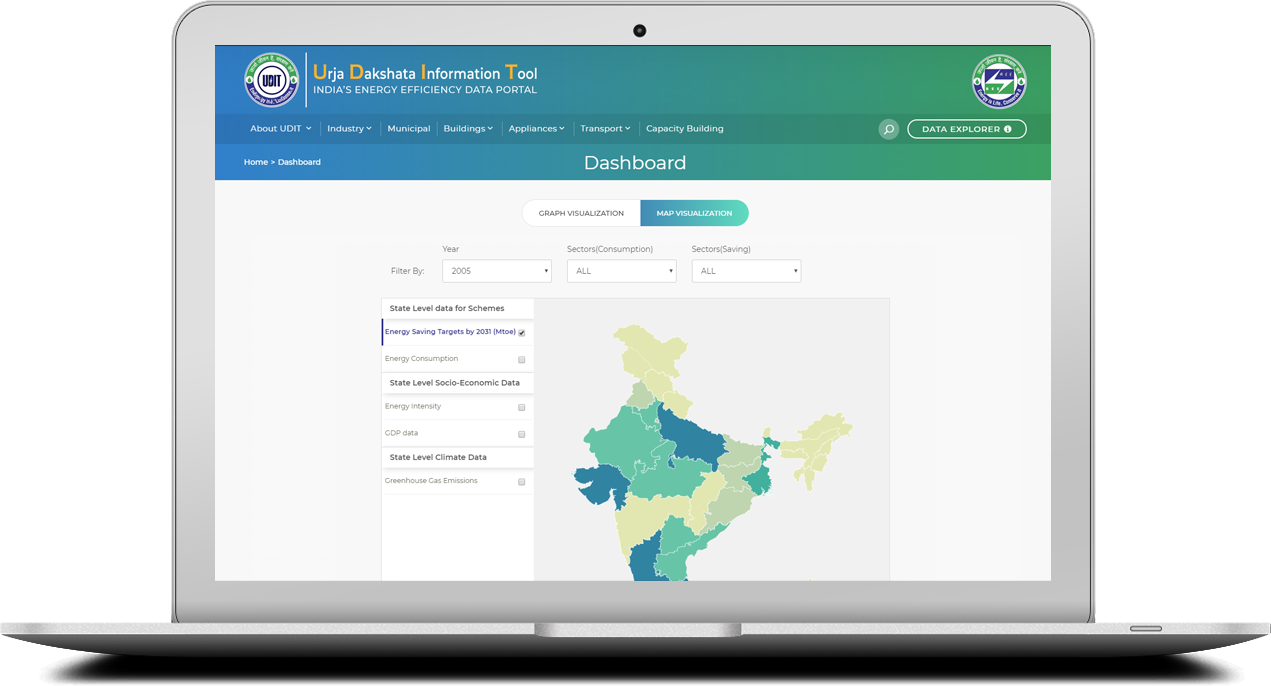
- Dashboard (Data Explorer): The dashboard allowed a map view and graphical visualization view. This was for advanced users who wanted to do analysis using the functionality of comparing variables within sectors, deep dive into sub-sectors of a scheme, multi-select variables from external sources to draw comparisons with energy efficiency schemes.
- Integration of energy efficiency with supply-side: As the energy efficiency schemes was a demand management side of the larger spectrum. The platform gave a provision to link with external sites that gave the different sources of energy supply in India. We also planned to do some storytelling around the link between Energy Efficiency and Renewable Energy through the platform on the Dashboard.
- Success Stories: Showed a collection of international, national, and scheme level success stories in the energy efficiency space. These were cataloged chronologically to showcase the latest achievement and give access to archives.
Key design aspect to develop this site was:
- User experience – convenience to analyze the information and
- Re-use of the information by various stakeholders (Government Officials, SMEs, consultants, researchers, and students).
UDIT is a platform that lets the audience engage and interact with the site. This was not a website but the first step towards a one-stop energy awareness program for India.
Conclusion
Ebizon had developed the platform keeping in mind not only the immediate use and its impact but also the scalability and maintainability of the platform.
The data visualizations and information elements of the site were dynamic and engaging that made this platform a one-stop solution for energy data queries and analysis.
An attempt was also made to smoothen the process to update this data in the future, making this site easily maintainable. Templates were defined and shared with the BEE team. The recommendation was to use these templates to gather data in the future. This allowed the BEE team to easily import the new data into the database and update the visualizations with new data.
The direct effect of this approach was to enhance the operational efficiency of data collection and utilization for the various Indian ministries and their internal departments e.g. Ministry of Power, Ministry of Commerce and Industry and Ministry of Environment, Forest and Climate Change.
Through this initiative, it is expected to save around 2.8 Billion Units by FY 2030, which is equivalent to Green House Gas (GHG) reduction of 2.4-million-ton Carbon Dioxide.
The projected efficiency improvement is between 42% to 65%.